Article
Using Metrics for Defect Hunting

January 5, 2018 ...

The Problem
Consider a project with a large code base you have recently inherited that has numerous known quality issues such as the F-35 software, or the ACA Healthcare Exchange Website. After examining the code, you have found many cases of poorly named variables and copy-and-paste coding, and you are now certain there are more defects than have been reported. How would you go about finding these defects in the software so that you can get them fixed?
Strategies that could be employed to find defects include going through each line of code and reviewing it, or testing each aspect of the system, among others. The problem with such strategies is they require brute force, which presents a challenge when faced with a large code base and limited time and staff.
An Analogy: Coin Hunting
In many ways the problem of hunting for defects in your code is like hunting for coins in a field that is being converted to housing. Some strategies that could be employed are:
- Looking where people have frequented.
- Looking at places where coins have been found in the past.
- Looking for landmarks such as large trees or rock piles (people tend to hide stashes near landmarks).
- Looking for areas of recently upturned ground (such as where a basement is being built).
- Using a metal detector.
Each of these strategies will help with finding coins, and used together will provide even better chances in your coin hunting expedition.
For software defect hunting, there is an analogous strategy for each of the above strategies that can be used to avoid “brute force” inspection:
- Code Churn: Looking where files have frequently changed.
- Defect Clusters: Look where defects have been found in the past.
- Cyclomatic Complexity: Look at areas of complexity in the code and treat them as potential landmarks.
- Re-examining Defect Fixes: Areas of recently fixed defects often have other defects.
- Static Analysis: Warnings and edge cases identified by static analysis and code security tools (such as tools formerly known as PREfix/PREfast, and Pex, which have been merged into some of the versions of Visual Studio).
Exploring the Strategies
Frequent Changes are a Risk
Nagappan and Ball investigated using code churn as a way to predict software defect density. They found a high correlation between relative code churn metrics and were able to predict with 89% accuracy whether a module was fault-prone or not. Tools available for determining code churn include: Microsoft TFS Code Churn Excel Report, and Atlassian’s Fisheye Delta Lines of Code graph.
Defects Tend to Cluster
Boehm’s research found that 20% of modules typically account for 80% of errors, and cited one example of IBM finding that 7% of modules accounted for 57% of defects. What this means is that if defects have been found in particular modules or files, it is likely that you’ll find additional defects if you look for them. McConnell suggests rewriting the module when the defect density is greater than 10 defects/KLOC (from Webopedia: “Short for thousands (kilo) of lines of code”).
Tools that combine defect tracking and version control such as Team Foundation Server will allow for determining such modules, although in some cases keyword or tag searches in a defect database or version control history will reveal frequent occurrences. Another type of clustering would be the category of defect — as certain programming practices are found to be defective, it is advisable to search the code base for similar instances. This approach is used by OpenBSD to maintain a high level of security through promoting good code quality in their code base.
Complexity Increases Likelihood of Defects
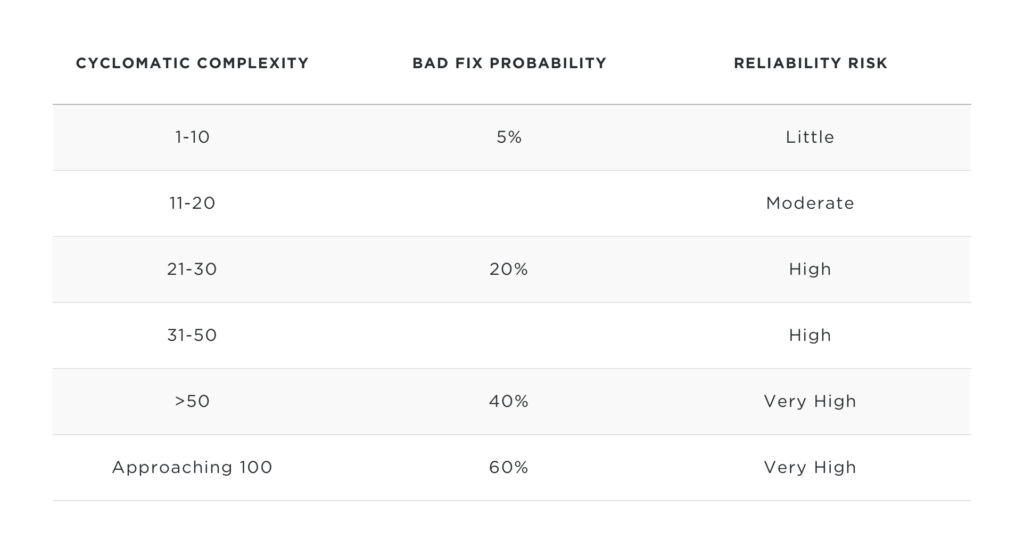
Ward found in his research that complexity of software (as measured by the McCabe cyclomatic complexity) had a high correlation to defect density. Additionally, Shin and Williams found that software complexity allowed reasonable predictive accuracy (between 80 and 99%) for security vulnerabilities. The cyclomatic complexity is provided in numerous tools ranging from Visual Studio to the free SourceMonitor. A common strategy for using cyclomatic complexity is to identify the highest scoring functions or methods and refactor them to reduce the complexity. Typically anything under 10 is ignored, although looking at 20 and higher is probably a safe demarcation point.
Defect Fixes Often Have Defects
Yourdon found in a study that the first attempt to fix a defect resulted in 50% of wrong fixes. Fixes can fail to account for all scenarios, or may break areas of dependency in parts of the app. Barring other good starting points, recent defect fixes are a good place to start.
If this results in a pool of candidates too large, combining with cyclomatic complexity is a good pairing for finding higher probability of defects. Recent defects in areas that are complex are likely to have more defects than in simpler areas. Dale Brenneman’s presentation “Software Reliability and Testing: Know When to Say When” provides the following additional information:
Dangers of Metrics Use
Metrics are in many ways like control charts in statistical process control. They provide a high-level view of large quantities of data, and allow you to filter out the noise (i.e. everything that is working as expected).
So with a stable repeatable system, control charts can be used to find what are statistical anomalies. When you have an anomaly indicated on the chart (such as going outside of the upper or lower control limits), that anomaly should be investigated to determine if it needs special attention.
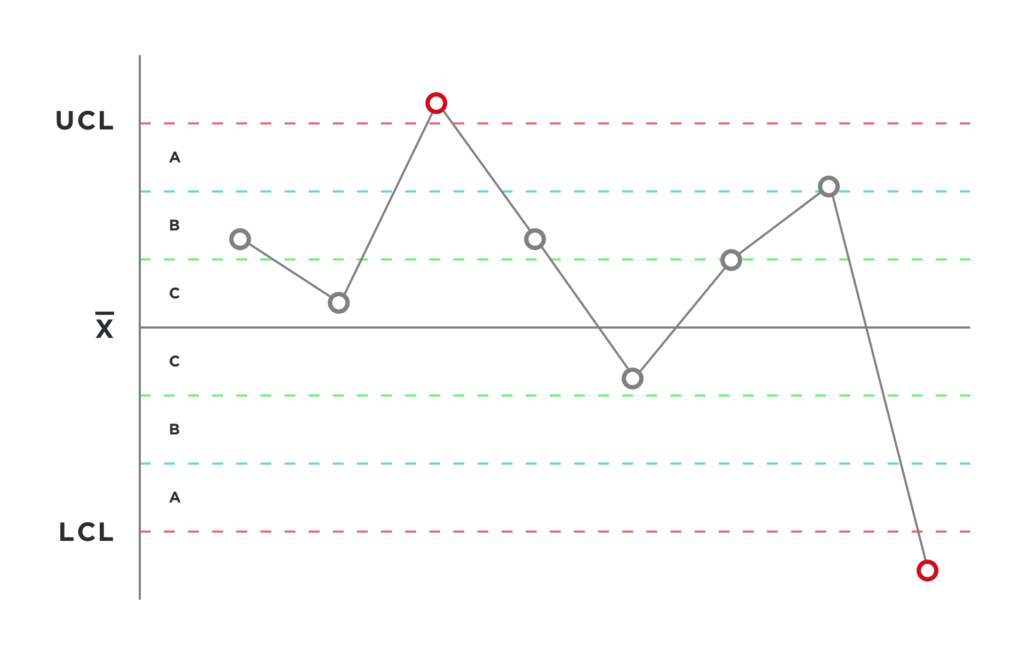
It is possible for something to go outside of the control limits and be completely acceptable for the process. Likewise you might have a metric indicating a high defect risk which is acceptable and has low defects.
For example, in the cyclomatic complexity metric a switch/branch/case statement will score high on the metric but can be very simple in each branch and defect-free. For a humorous look at the dangers of misapplying metrics, please see defect researcher Andreas Zeller’s presentation:
Summary
Metrics can be used to help filter out noise and allow for targeting your limited resources to the areas that matter most for defect removal. Investigative effort can’t be entirely avoided by the use of metrics, but taking a strategic approach allows these efforts to be executed intelligently.
Attributions
- “Control Chart Rule 1” by GMcGlinn under “Creative Commons Attributions-Share Alike 3.0 Unported” license.